Your gaming rig screams during load—but not from performance. It’s the fans. You’ve tweaked RPMs, swapped coolers, even undervolted your GPU. Yet noise persists or temps spike under sudden load. Why? Because you’re ignoring the fan performance curve—the invisible governor between silence and thermal control. Here’s how to master it.
Why Most Gamers Misunderstand Fan Curves
Most treat fan curves like volume knobs: higher numbers = cooler = better. Wrong. A flat, aggressive curve runs fans at 80%+ even when idle—wasting power, generating unnecessary noise, and accelerating bearing wear. Worse, linear response fails under real-world gaming loads where heat spikes are sudden and uneven.
Think about it: Modern GPUs can jump from 45°C to 78°C in 90 seconds when launching Cyberpunk. A static curve can’t react intelligently. And no—BIOS defaults aren’t “optimized.” They’re generic compromises baked by OEMs who’ve never stress-tested your exact build.
Fan Performance Curve Explained: Your Step-by-Step Tuning Blueprint
Forget presets. Real tuning starts with observation, then precision adjustment. Do this:
Baseline Monitoring First
Run a 20-minute stress test (FurMark + Prime95). Log temps, fan RPMs, and dB levels every 60 seconds. Note where noise becomes intrusive versus where throttling begins. That gap is your tuning window.
Hysteresis Is Your Secret Weapon
Most software (MSI Afterburner, FanControl) lets you set hysteresis—dead zones that prevent rapid RPM cycling. Set it to 3–5°C. Without it, your fans hunt up and down like a broken elevator, creating more perceived noise than steady operation.
Non-Linear Curves Beat Linear Every Time
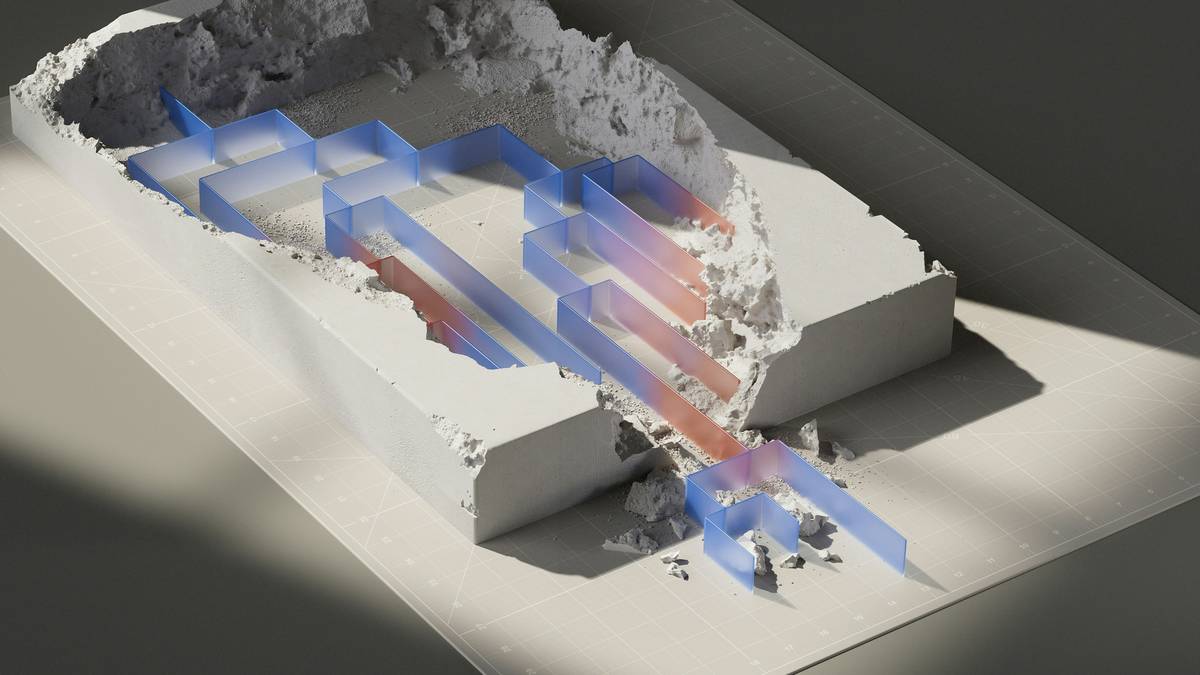
Don’t draw straight lines. Use S-curves: gentle slope from 30–55°C (silent idle), sharp rise from 55–70°C (gaming response), then plateau near 80°C (thermal safety net). This mirrors actual heat generation—not imaginary linearity.
| Curve Type | Noise Level (dB) | Peak Temp (°C) | Fan Lifespan Impact |
|---|---|---|---|
| Stock Linear (OEM Default) | 38–42 | 72 | Moderate wear |
| Aggressive Flat (80% Always) | 46–49 | 65 | High wear—bearings degrade faster |
| Custom S-Curve (Recommended) | 28–34 | 69 | Low wear—optimal balance |
The Industry Secret: Fans Lie About Their Curves
Here’s what engineers won’t tell you: PWM signals aren’t universal. A “50%” signal on ASUS motherboards may spin a Noctua fan at 62%, but the same signal on Gigabyte might hit 57%. Why? Tolerance stacking in voltage regulation and fan controller ICs. And cheaper fans? They often ignore low-end PWM signals entirely—stalling below 30% instead of modulating smoothly.
So when you copy someone’s “perfect curve” from Reddit, it physically can’t behave the same in your system. You must calibrate per-fan, per-mobo. Test with HWiNFO64’s fan duty cycle readout—not just RPM. That’s where the truth lives.
Frequently Asked Questions
What is a fan performance curve?
It’s a graph mapping fan speed (RPM) against temperature input. Properly tuned, it balances cooling and noise dynamically—not statically.
Should I use auto or manual fan curves?
Never auto. Manual gives you hysteresis control, curve shape freedom, and avoids OEM algorithms that prioritize component longevity over user experience.
Do CPU and GPU fans need separate curves?
Absolutely. GPUs throttle faster than CPUs. Their curve should be steeper above 65°C. CPUs benefit from wider hysteresis to avoid pump cycling during brief spikes.